One of my regular activities is to track the editorial staff comings and goings at print publications to which I submit news releases (pu-leeese don’t call them press releases) thus I’m sure to send our clients’ news to the right person.
So today I was updating my contacts at Diesel & Gas Turbine Worldwide to add the recent change of Publisher & Editor, to Sheila Gailloreto. And thanks to her “Publisher’s Column” in the March 2009 issue, I learned about the Baltic Dry Index.
“As I was completing some research for an article published within these pages, I stumbled across a link for the Baltic Dry Index …
Referred to as one of the ‘purest leading indicators of economic activity’ … the Baltic Dry Index or BDI number, issued daily by the London-based Baltic Exchange, ‘measures the demand to move raw materials and precursors to production as well as the supply of ships available to move this cargo’.”
As Ms. Gailloreto points out in her column, there is no speculation involved in this index. It bears repeating that it’s considered one of the purest leading indicators of economic activity.
The Baltic Dry Index monitors and reports on transactions happening in the real world in terms of the demand for resources for the manufacture and production of goods worldwide.
Thanks to Ms. Gailloreto’s intriguing find, I too needed to learn more and turned to Google. Among the many references to the Baltic Dry Index, www.wikinvest.com pops up large.
Consumer spending and other economic indicators are backward looking, meaning they examine what has already occurred. The BDI offers a real time glimpse at global raw material and infrastructure demand.
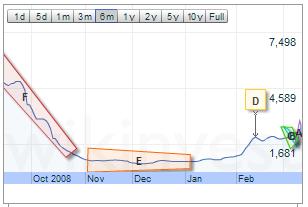
There’s more good background information about the BDI on this page at wikinvest.com, but I found the BDI chart below the most interesting item.
Here’s a screen shot I took of the chart today, looking over the last 6 months:

And here’s the chart itself, live. (Apologies if you see the Flash Player notice, I can’t get rid of it.) Tabs at the top of the chart enable you to choose the period of time over which you wish to see the data.
This clearly shows a slowly growing (dare I say recovering) worldwide market, and for all of us that’s a very positive thing to see with our own eyes.
Cheers … and remember, expect good things!
 Flash Player 9 or higher is required to view the chart. Click here to download Flash Player now
Leave a Reply